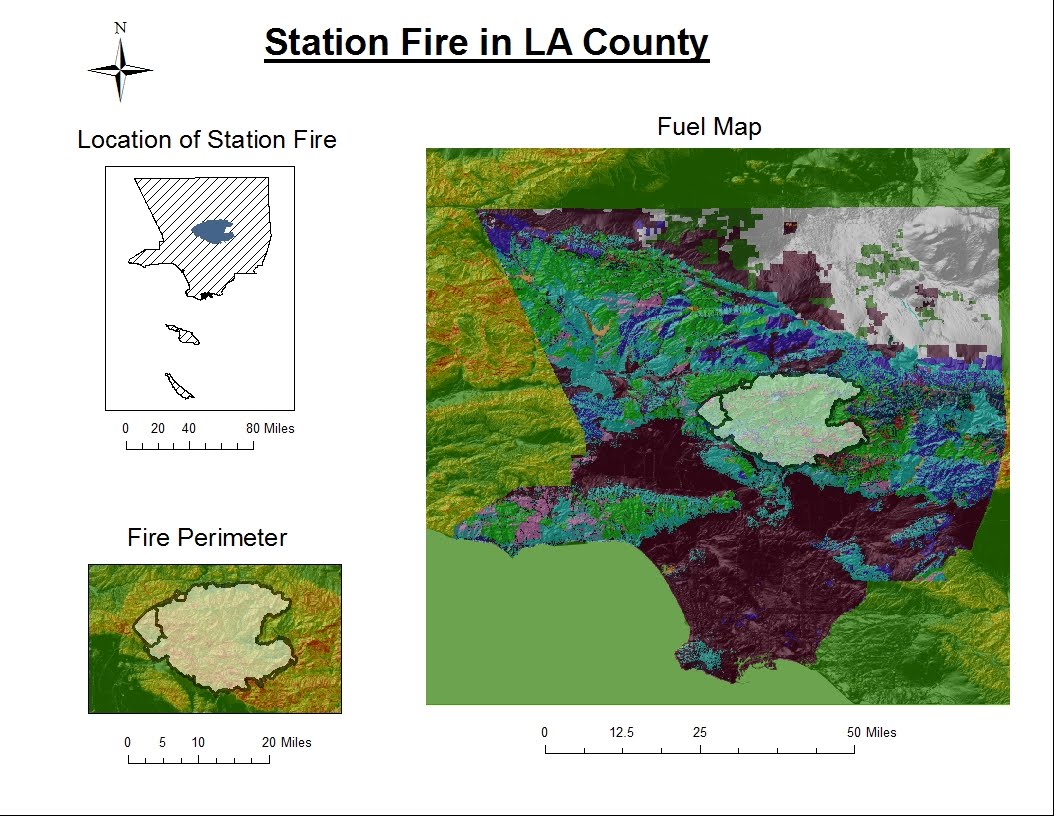
To create this map of the Station Fires in Los Angeles County, I downloaded a DEM from the USGS website and got the landcover/vegetation data and the perimeter data from The California Department of Forestry and Fire Protection's Fire and Resource Assessment Program (FRAP) website. I also downloaded the LA county polygon from the UCLA GIS website. It was not difficult to download the correct DEM or the LA county polygon, but I had some difficulty finding the correct vegetation data. The perimeter data was easy enough to find on the FRAP website, as was the fuel data, but I had a friend help me with the vegetation data.
This map was pretty difficult to make, as there were no exact steps in this lab as there have been in others. I had some trouble with the hillshade, and was not able to manipulate it to be the same size as LA county. I merged all of the Station Fires together to create one large perimeter that encompassed all of the perimeters. I then overlaid the slope and hillshade data that I created with the Spatial Analyst tool. I then added the fuel and vegetation data.
There were many difficult parts to this lab, and I feel that we have not had enough practice to be able to create a very good map with minimal instruction. Spatial Analysis is very challenging, and I feel that I was not able to do as much with this lab as I have with others. However, I did feel that this was a very good learning experience, and taught me a lot about ArcGIS and my own GIS skills.
No comments:
Post a Comment